Module 1: Introduction to UI and performance testing
learn how to do performance testing using wdio, selenium grid, InfluxDb and Graphana
UI Performance Testing Architecture Overview
Architecture of the End-to-End Setup
The system is composed of five primary components:
- WebdriverIO (WDIO) – runs automated browser-based tests
- Selenium Grid – distributes test sessions across multiple browser containers
- Docker – containers the infrastructure (Grid, nodes, InfluxDB, Grafana)
- InfluxDB – stores performance metrics (e.g., response time, duration)
- Grafana – visualizes performance data in real time
End-to-End Data Flow local setup
Underneeth the End-to-End Data flow in a local setup
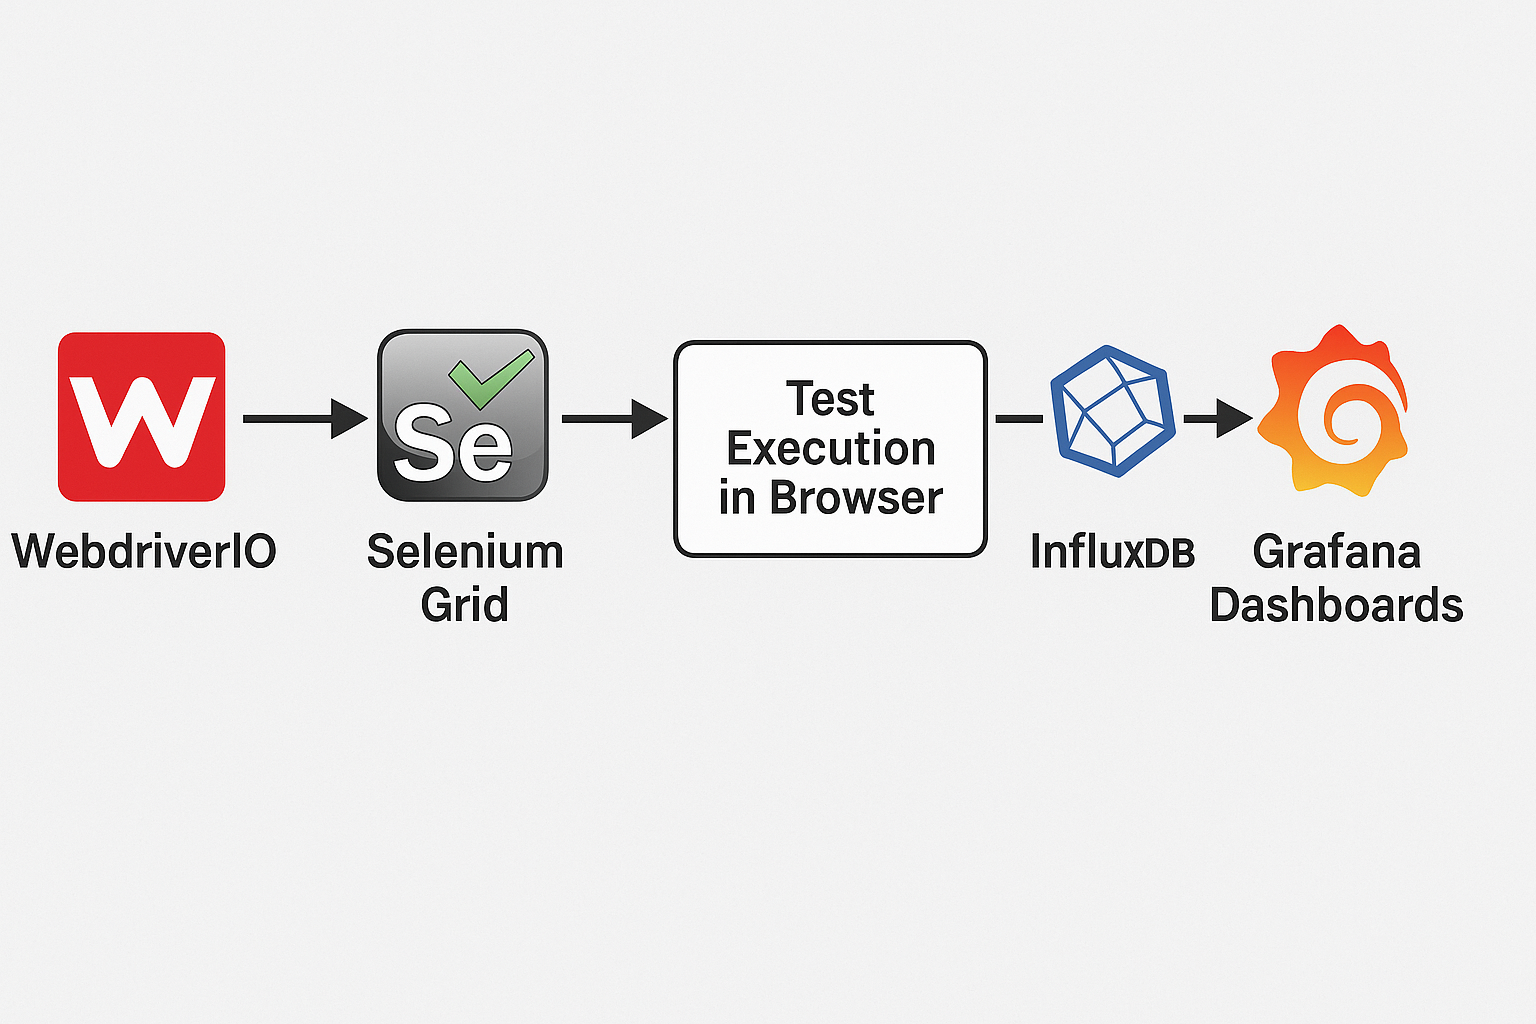
Diagram: Visual representation of the end-to-end performance testing stack, from test runner to dashboards.
🧠 Benefits of This Setup
- Automation + Monitoring: Fully automated performance test including monitoring
- Real-Time Insights: Instantly see metrics during or after test runs
- Containerized: Easily reproducible and scalable using Docker
Architecture Overview with AWS Cloud
Underneeth a picture how it should look for example using in the AWS cloud. This can also be setup in kubernetes, but that is not in the scope of this course
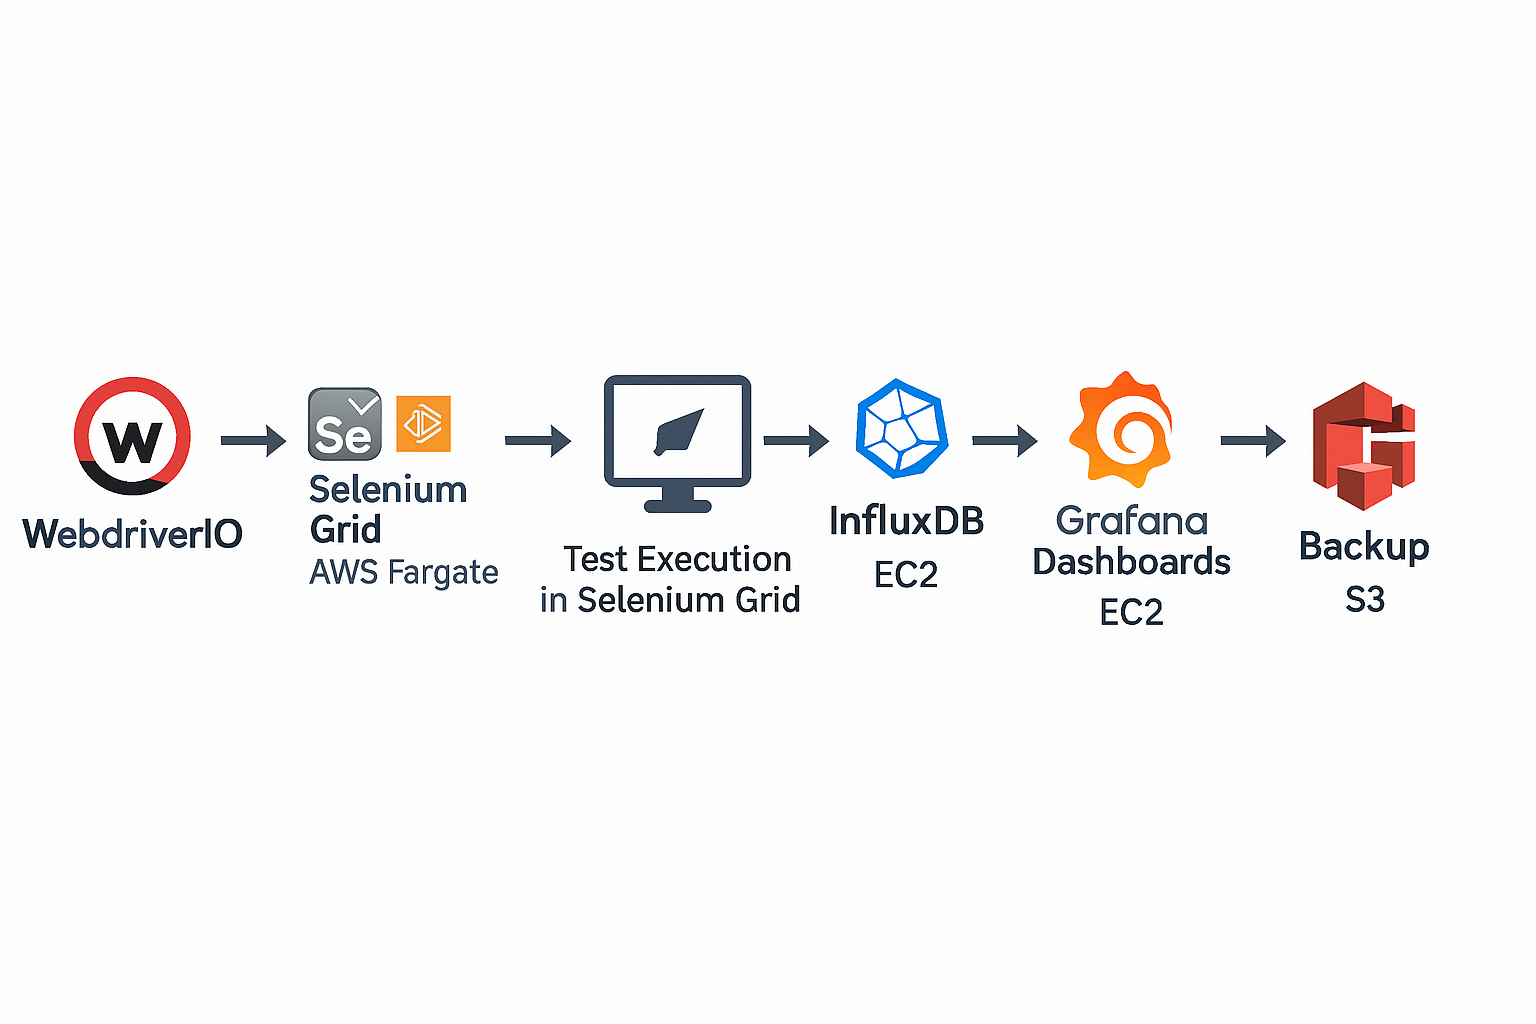
Scalable UI Performance Testing with Selenium Grid on AWS
in the end of the course we are going to do a reliable performance test with ui using aws fargate. web applications grow increasingly complex, performance testing from the UI layer becomes vital. In this post, we’ll walk through an efficient cloud-based architecture to execute large-scale UI performance tests using Selenium Grid on AWS Fargate, while using EC2 to persist and visualize test metrics with InfluxDB and Grafana.
Why This Architecture?
- Selenium Grid on AWS Fargate As mentioned, it offers scalability for executing UI tests without managing infrastructure.
- InfluxDB on EC2 stores performance metrics captured during test runs.
- Grafana on EC2 provides a rich visualization layer for dashboards and alerting.
- Amazon S3 is used to back up InfluxDB data, allowing EC2 instances to be shut down when idle and restored on demand.
📐 Components Explained
1. WebdriverIO Test Runner
Tests are written using WebdriverIO and executed either locally or via CI/CD. These tests target the Selenium Grid for distributed browser execution.
2. Selenium Grid on AWS Fargate
Deployed as containerized services, Selenium Hub and browser nodes run in a fully managed serverless environment. This enables scaling and parallel test execution without server provisioning.
3. Test Execution in Grid Browsers
Each test session runs in an isolated browser container managed by the Selenium Grid. Metrics are captured using WebdriverIO hooks.
4. InfluxDB on EC2
All performance metrics from the test runs are pushed to InfluxDB running on an EC2 instance. This makes querying, analysis, and dashboard creation easy.
5. Grafana on EC2
Grafana reads data from InfluxDB and displays interactive dashboards that can show trends like response time, success/failure rate, and throughput.
6. Amazon S3 Backup
To keep infrastructure costs low, InfluxDB data is backed up to S3. This allows the EC2 instance to be shut down after test runs and restored later with metrics intact.
💡 Key Benefits
- Scalable, stateless test execution via Fargate
- Persistent metric storage and visualization via EC2
- Automated cost optimization with backup/restore to S3
- Minimal manual server management
This architecture brings together scalability, cost-efficiency, and flexibility to support modern performance testing workflows. Perfect for teams who want to shift-left on performance without breaking the bank.
in the coming lessons we will show you how to run this locally, in the later lessons you can if you have an aws account try to set it up in the cloud using aws cdk in fargate. Note there are costs when you set this up in AWS, so make sure to clean it once you are done with the course